From data to decision in minutes
The AI Data Analyst: Connect your data, ask questions, and get insights in seconds. No coding required.
Setup in 2 min·Your data stays yours
Three steps to better decisions
No BI backlog. No SQL. Just connect, ask, and decide.
Connect your data
Upload CSV or Excel, or connect to PostgreSQL, MySQL, SQL Server, Oracle. One source of truth, secured and ready.
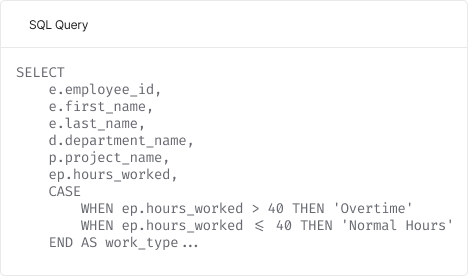
Ask in plain language
Type what you need: "Sales by region last quarter", "Where are we losing deals?". Get answers in seconds, not tickets.
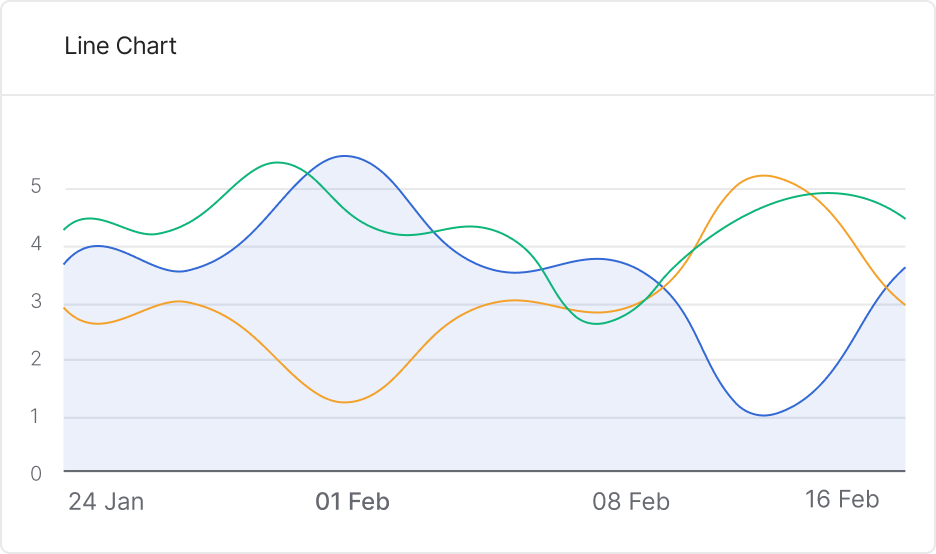
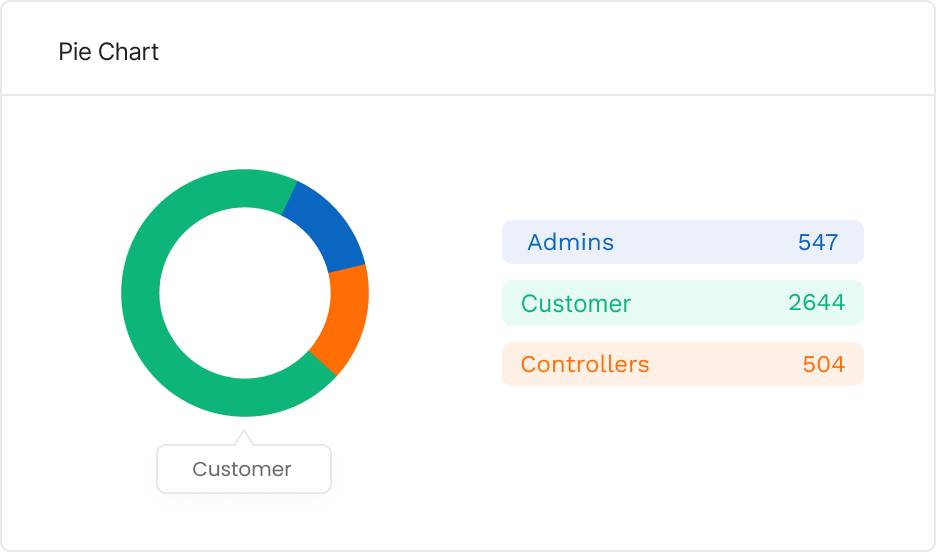
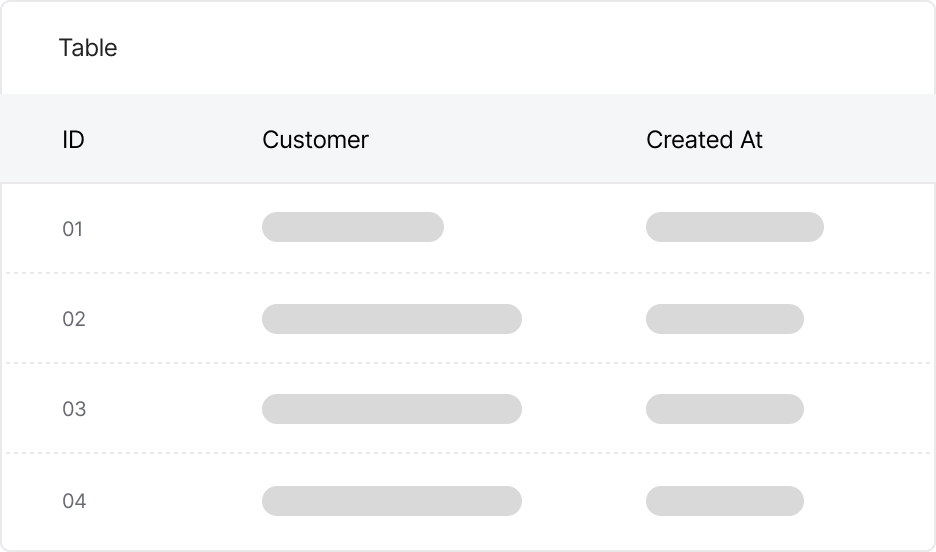
Get dashboards & decide
Insights and tables appear instantly. Save decision dashboards, export for exec reviews, share with your team. No code required.
Built for decision-makers
Whether you run sales, finance, ops, or growth - get the answers you need to act, not just report.
Board & exec reviews
Decision-ready dashboards in minutes. No more last-minute slides.
Sales & pipeline
Instant visibility on deals, forecasts, and team performance.
Finance & budgeting
Budget reviews, variance analysis, and forecasts from your data.
Marketing & growth
Campaign performance, conversion, and ROI - ask and decide.
Ask in plain language. Get insights and decisions in seconds.
No formulas, no SQL. Type what you need - sales by region, pipeline by stage, churn by cohort - and get the right chart or table instantly. Save dashboards and share with your team.
- Decision-ready dashboards
- Export PNG, CSV, PDF
- One source of truth
- No code, no waiting
What our customers say
Quelques retours simples de personnes qui utilisent GraphAsk pour décider plus vite à partir de leurs données.
"GraphAsk helps me build my management reports in a few minutes instead of half a day. I can answer management questions live, with their own numbers."
"When my team asks for numbers, I just type the question in GraphAsk and get the chart. No more waiting for a custom Excel file."
"We use GraphAsk for our monthly meetings: same data, same interface for everyone. Fewer files, fewer emails, and faster decisions."
Plans that scale with your decisions
From solo use to teams and enterprise. More questions, more AI recommendations, more impact.
Premium
- 500 AI questions/month
- AI chart suggestions & written decision recommendations
- Decision dashboards you can export & share
- Priority email support
Team
- 3000 queries/month
- Up to 5 users, shared dashboards & collections
- AI recommendations for the whole team
- Priority support
Enterprise
- Unlimited queries
- White-label & API
- Dedicated manager
- Security & compliance
Frequently asked questions
Ready to decide with data?
Join teams who turned their data into decisions. No credit card required.